Key Takeaways:
- Waves prices eye a fall to $10 on the daily charts.
- The forecast comes from a double top pattern on its daily charts.
NEW DELHI (CoinChapter.com) — Multi-purpose blockchain platform Waves (WAVES) is currently plotting a bearish technical reverse pattern, called a double top, on its daily charts.
The double top pattern forms after an uptrend. When an asset reaches high two consecutive times with some decline between the two, it forms a double top pattern. In addition, the two peaks form above a support level called a neckline. After prices form the second top, a move below the neckline confirms the pattern.
The price target for the breakout is the distance between the tops and the neckline.
For WAVES, the downside target is at $10, a fall of 48% from current prices. The digital asset fell nearly 14% on Saturday’s crypto washout before recovering 4.8% on Sunday. Waves prices are trying to rally, but the current price movement is lateral.
WAVES is currently struggling to move above $20. Additionally, the double top’s neckline acts as immediate resistance for Waves. If prices breach above the neckline, it will target resistance at $23.
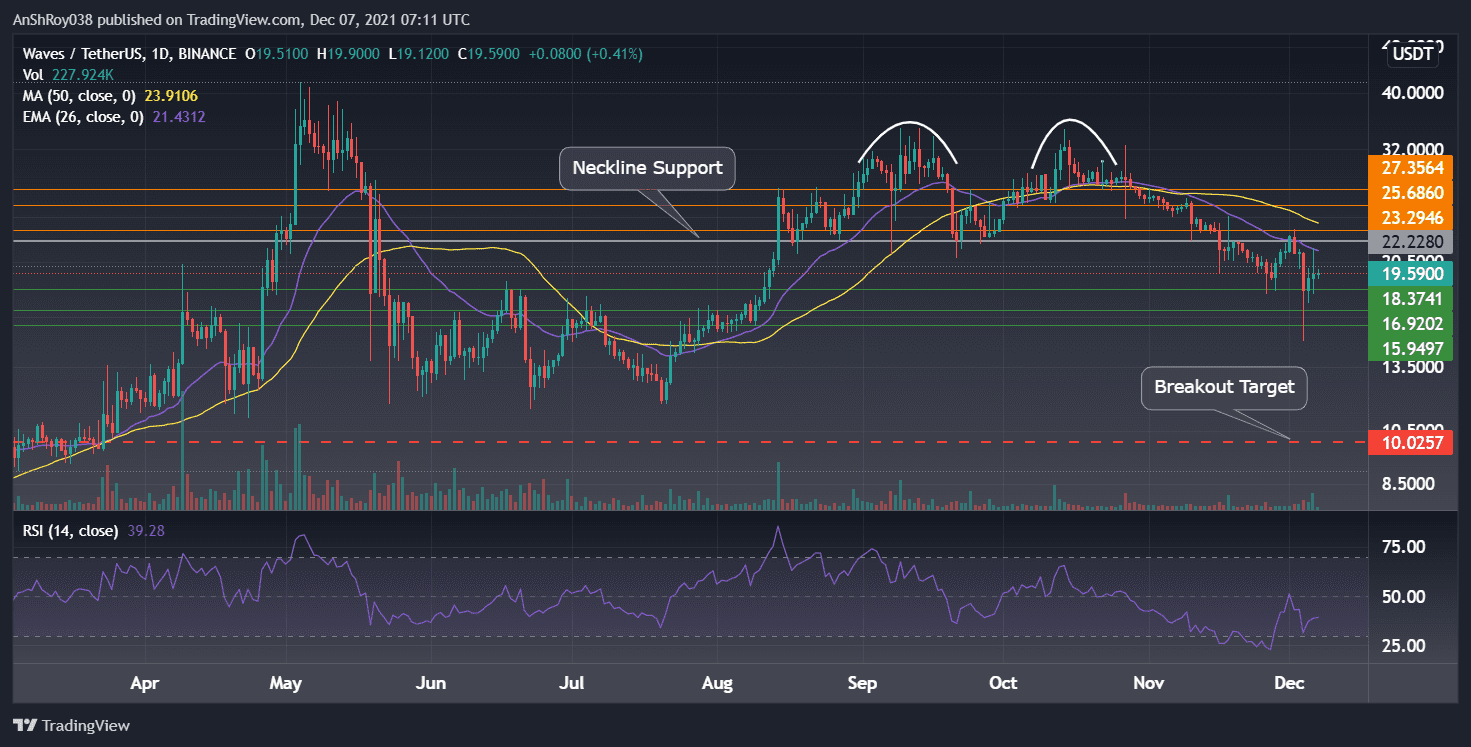
Moreover, a breach above the neckline would indicate the technical pattern has failed and might call the bulls into action. Hence, prices could rise to $25, near WAVES 100-day MA line. On the other hand, bears would likely try to push prices further down, causing the crypto to fall to immediate support at $18.
Also Read: Algorand (ALGO) could pump 130% in Q1 2022 — here’s why.Moving towards the pattern’s price target would bring the support at $16.9 into play. Additionally, the relative strength index for WAVES is currently neutral, clocking 39.28 on the daily charts. The RSI trendline is following the token’s price action, moving laterally.
Trend-based momentum oscillator MACD is struggling to remain bullish for WAVES. However, contracting bars on the MACD histogram indicate that the MACD line (difference between 12-day and 26-day) is moving towards its signal line (9-day EMA of MACD).
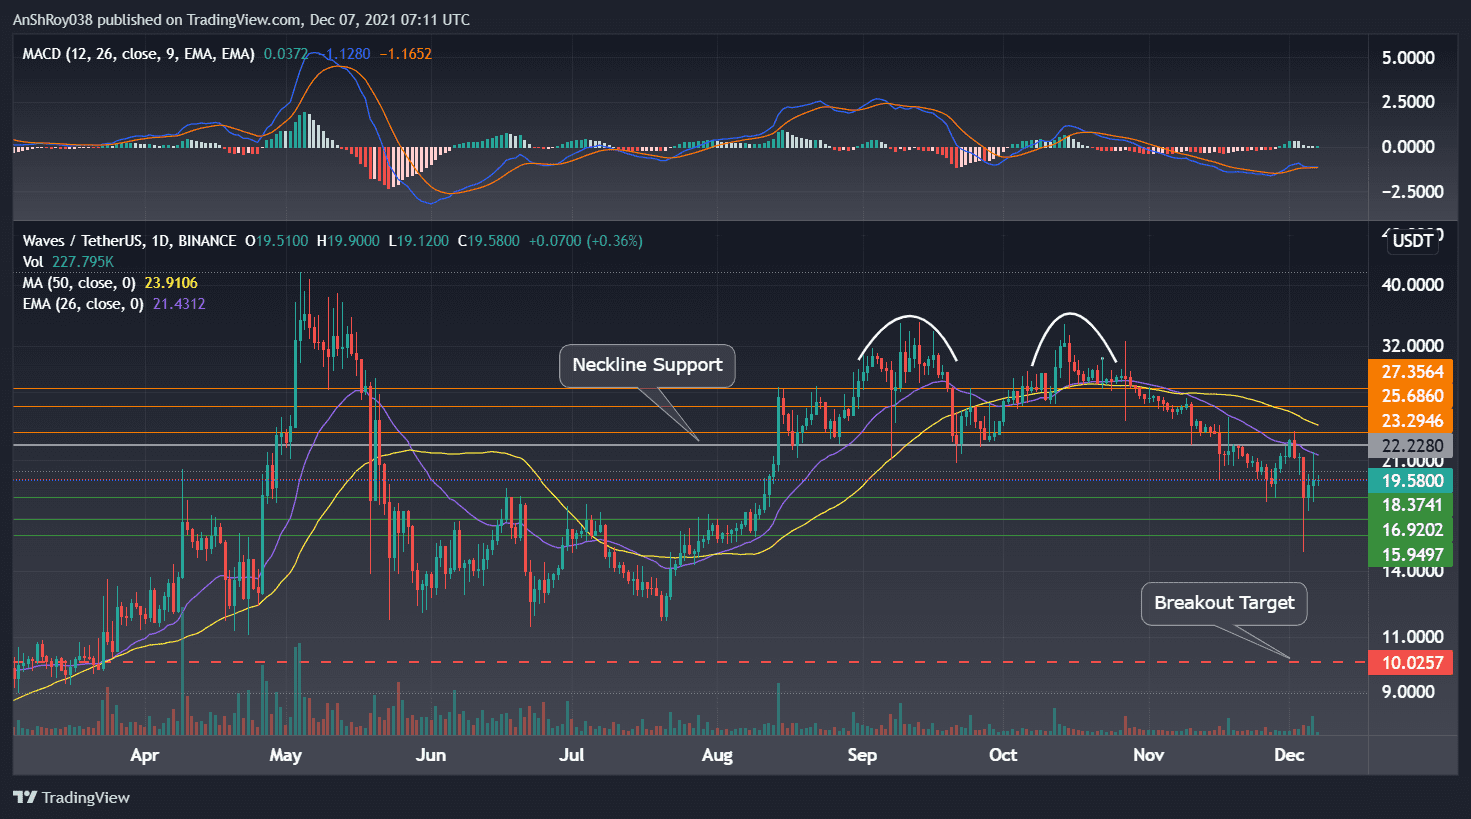
The MACD charted a bullish crossover on Nov 29 and now seems poised to paint a bearish crossover. Since retail traders often view bearish crossovers as sell signals, a further pullback is likely.
What Is WAVES?
WAVES is the native token of the Waves blockchain platform. Waves has various use cases, including dApps and smart contracts. The platform allows users to create and launch custom crypto tokens without extensive knowledge of smart contract programming.
Also Read: Cosmos (ATOM) eyes a 160% uptrend on a confluence of bullish factors.The platform uses a variation of the proof-of-stake (PoS) consensus mechanism, called leased PoS. In this system, users can lease their WAVES token to a single node to make it eligible for adding blocks on the blockchain. As a result, when the node is selected to produce the next block, all the nodes that leased tokens get compensated.
At the time of writing, WAVES was trading at $19.57, up 1.66% on the day. On Monday, the token swung wildly, falling over 16% high ($21) to low ($18) before recovering.

… [Trackback]
[…] Info to that Topic: coinchapter.com/waves-eyes-48-fall-as-it-breaks-out-of-a-bearish-technical-setup/ […]