

Key Holo Outlook
- Holo prices (HOT) break bearish on its previous Descending Triangle with half-hearted momentum.
- The move shows traders’ intention to wait for an upside recovery amid choppiness across the entire cryptocurrency market.
- Meanwhile, a doubtful bullish flag pattern emerges.
Yerevan (CoinChapter.com) — Holo (HOT) is pursuing slow and steady decline.
The mid-cap cryptocurrency broke below a descending triangle pattern earlier this week, as CoinChapter.com had anticipated in its previous analysis. That signaled traders’ intention to target deeper support levels, especially after the HOT/USDT’s incredible price rally of up to 5,347 percent in 2021. They used the pair’s record highs to secure profits. As a result, it corrected lower by as much as 57.28 percent.
Read more: Holo (HOT) Follow Up 2: Bearish Triangle Overpowering Bullish Wedge
A correction of more than 50 percent after a parabolic bullish move typically signals reversal sentiment. But cryptocurrencies are a tad bit different from traditional assets. They can fall more than 100 percent in a day to pare all the losses in the next session. Therefore, analysts typically focus on short-term scenarios to minimize their risks. HOT is no different.
Holo’s Bearish Targets
As noted, the Holo token’s bearish breakdown move below its Descending Triangle pattern has been slowing down. Traders want to wait for clear signals before deciding on their short-term bias.
Therefore, the HOT/USDT exchange sits below its Triangle support level, awaiting a recovery to reclaim it as its interim price floor. Its 50-day simple moving average (50-DMA; the blue wave in the chart below) provides additional support to strengthen the short-term upside bias.
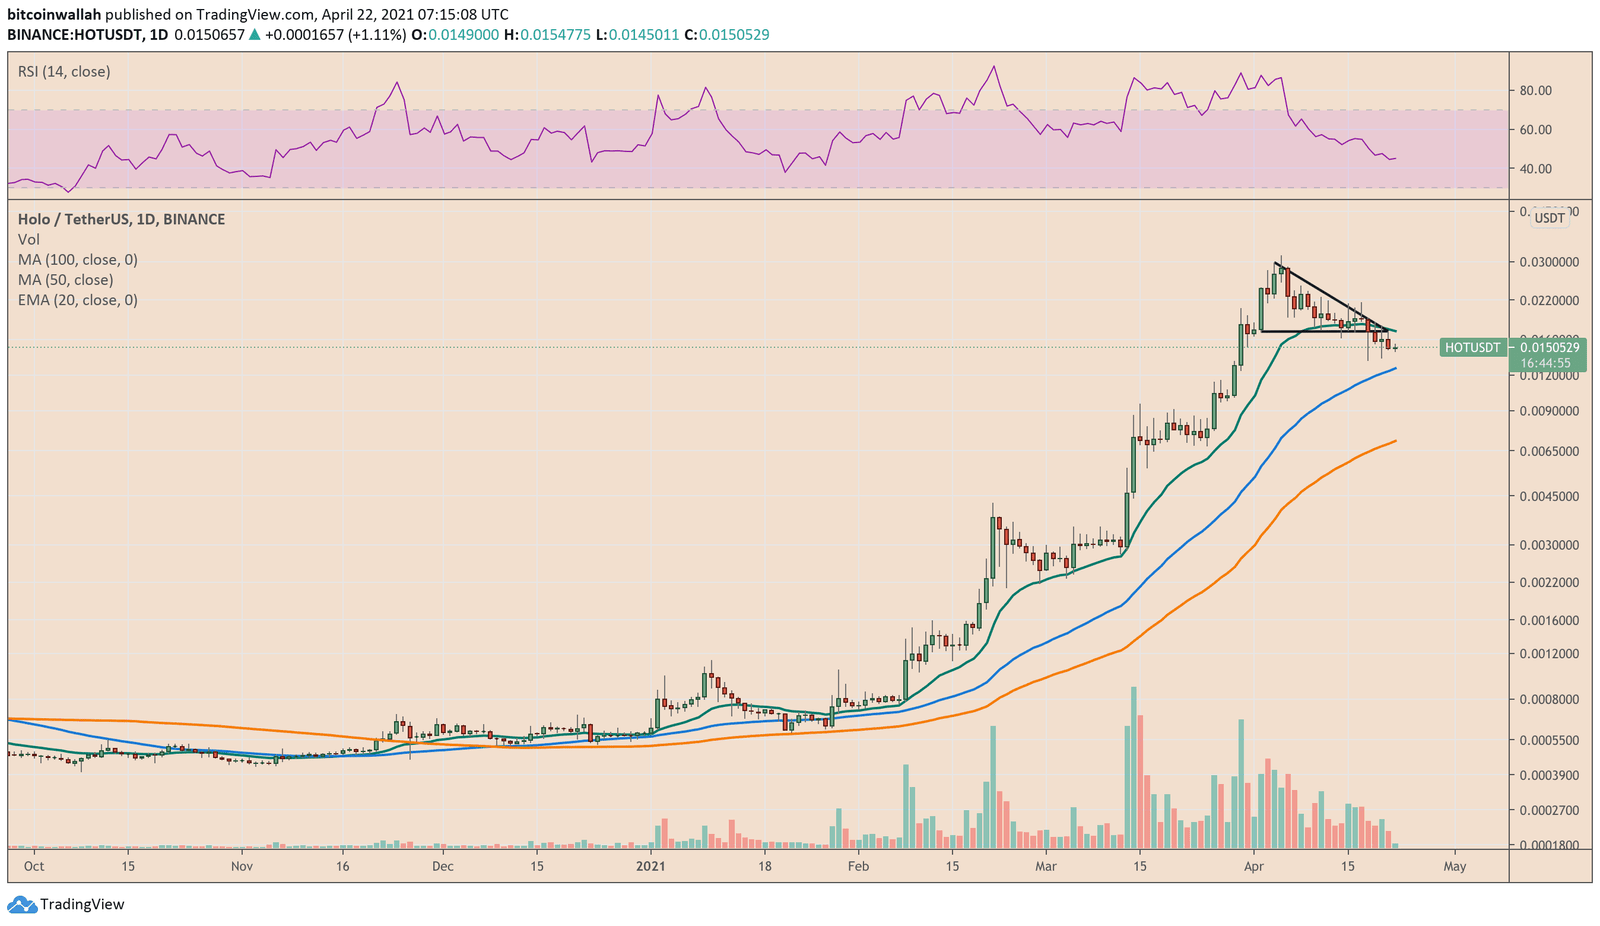
Any additional selling pressure from where the price trades now tends to shift traders’ interim short target towards the 50-DMA. Later, they could expect to wait for a rebound towards the 20-day exponential moving average (20-DMA; the green wave) while keeping the other eye on an extended bearish move towards the 100-day simple moving average (100-DMA; the orange wave).
The moving average waves have provided accurate support/resistance cues in the recent daily sessions.
Meanwhile, should the Descending Triangle breakdown pick momentum, the overall downside target for the HOT/USD rate would shift to near $0.0045, a mid-March 2021 support level. That is the extreme bearish case for the Holo token for now.
The Bullish Flag Theory, Meanwhile
Adjusting the Descending Triangle trendlines in the Holo price chart also suggests forming a bull flag pattern.
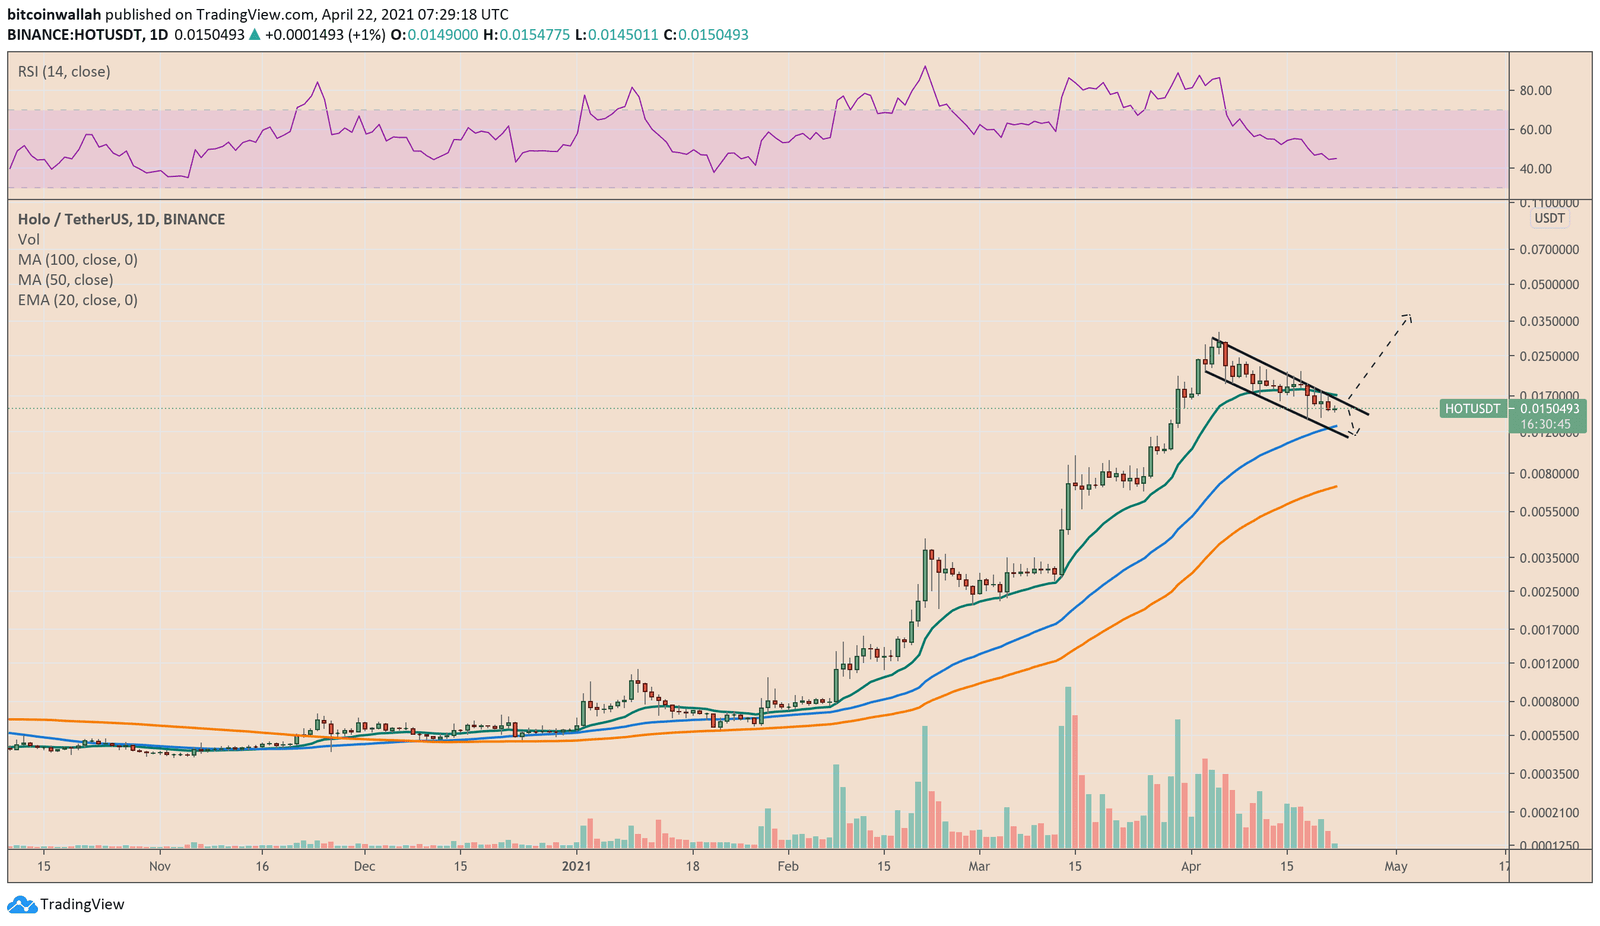
In retrospect, Bull Flags are downside consolidation patterns that appear during an uptrend. They intend to send the prices in the direction of their previous upside trends by as much as the length of the previous rally. Holo somewhat checks all the boxes to qualify as the token trading inside a bull flag, except one.
The only glitch is HOT/USDT’s 50 percent-plus downside correction. Technically, if the retracement becomes deeper than 50 percent, it may not be a bull flag pattern. Nonetheless, the pair expect to rise by as much as $0.024 should it breaks above the flag resistance trendline. Else, it would pursue the bearish targets as discussed in the previous section.
Trade safe, HOT bulls.
Photo by Ray Hennessy on Unsplash
… [Trackback]
[…] There you can find 83125 additional Information to that Topic: coinchapter.com/holo-hot-follow-up-3-triangle-breakdown-slows-down-but-downside-risks-persist/ […]
… [Trackback]
[…] Information to that Topic: coinchapter.com/holo-hot-follow-up-3-triangle-breakdown-slows-down-but-downside-risks-persist/ […]
… [Trackback]
[…] Find More Information here to that Topic: coinchapter.com/holo-hot-follow-up-3-triangle-breakdown-slows-down-but-downside-risks-persist/ […]
… [Trackback]
[…] Read More here on that Topic: coinchapter.com/holo-hot-follow-up-3-triangle-breakdown-slows-down-but-downside-risks-persist/ […]
… [Trackback]
[…] Read More on that Topic: coinchapter.com/holo-hot-follow-up-3-triangle-breakdown-slows-down-but-downside-risks-persist/ […]